- Arcblock crypto’s price has increased by 64% in the last 30 days.
- Bullish pressure is significant in the token’s market.
ABT, the native token of Arcblock crypto, a platform designed to simplify the development of decentralized applications (DApps), is poised to extend its double-digit rally as bullish pressure gains momentum.
At press time, the altcoin exchanged hands at $3.76, witnessing a 20% price rally in the last 24 hours. In the last month, ABT’s price has surged by 64%, according to CoinMarketCap’s data.
ABT’s path to glory
AMBCrypto’s assessment of ABT’s price movements on a daily chart confirmed the possibility of a sustained price rally in the short to mid-term.
At press time, the token’s key momentum indicators rested above their respective center lines, suggesting significant buying activity.
For example, ABT’s Relative Strength Index (RSI) was 68.97, while its Money Flow Index (MFI) rested in the overbought zone to return 89.75.
At these values, these indicators signaled a preference for ABT accumulation over its distribution by market participants.
Similarly, its Chaikin Money Flow (CMF) was 0.22. This indicator, which tracks the flow of money into and out of ABT, suggested that the market was flush with the liquidity necessary to sustain the current price rally.
Confirming the current bullish trend, the dots that make up ABT’s Parabolic SAR rested below the coin’s price at press time.
This indicator is used to identify potential trend direction and reversals. When its dotted lines are placed under an asset’s price, it confirms that the market is in an uptrend.
Traders interpret it as a sign that the asset’s price has been rising and may continue.
Lending credence to this was ABT’s Elder-Ray Index. It has returned only positive values since 30 April.
The indicator measures the relationship between the strength of ABT buyers and sellers in the market. When its value is positive, it means that bull power dominates the market.
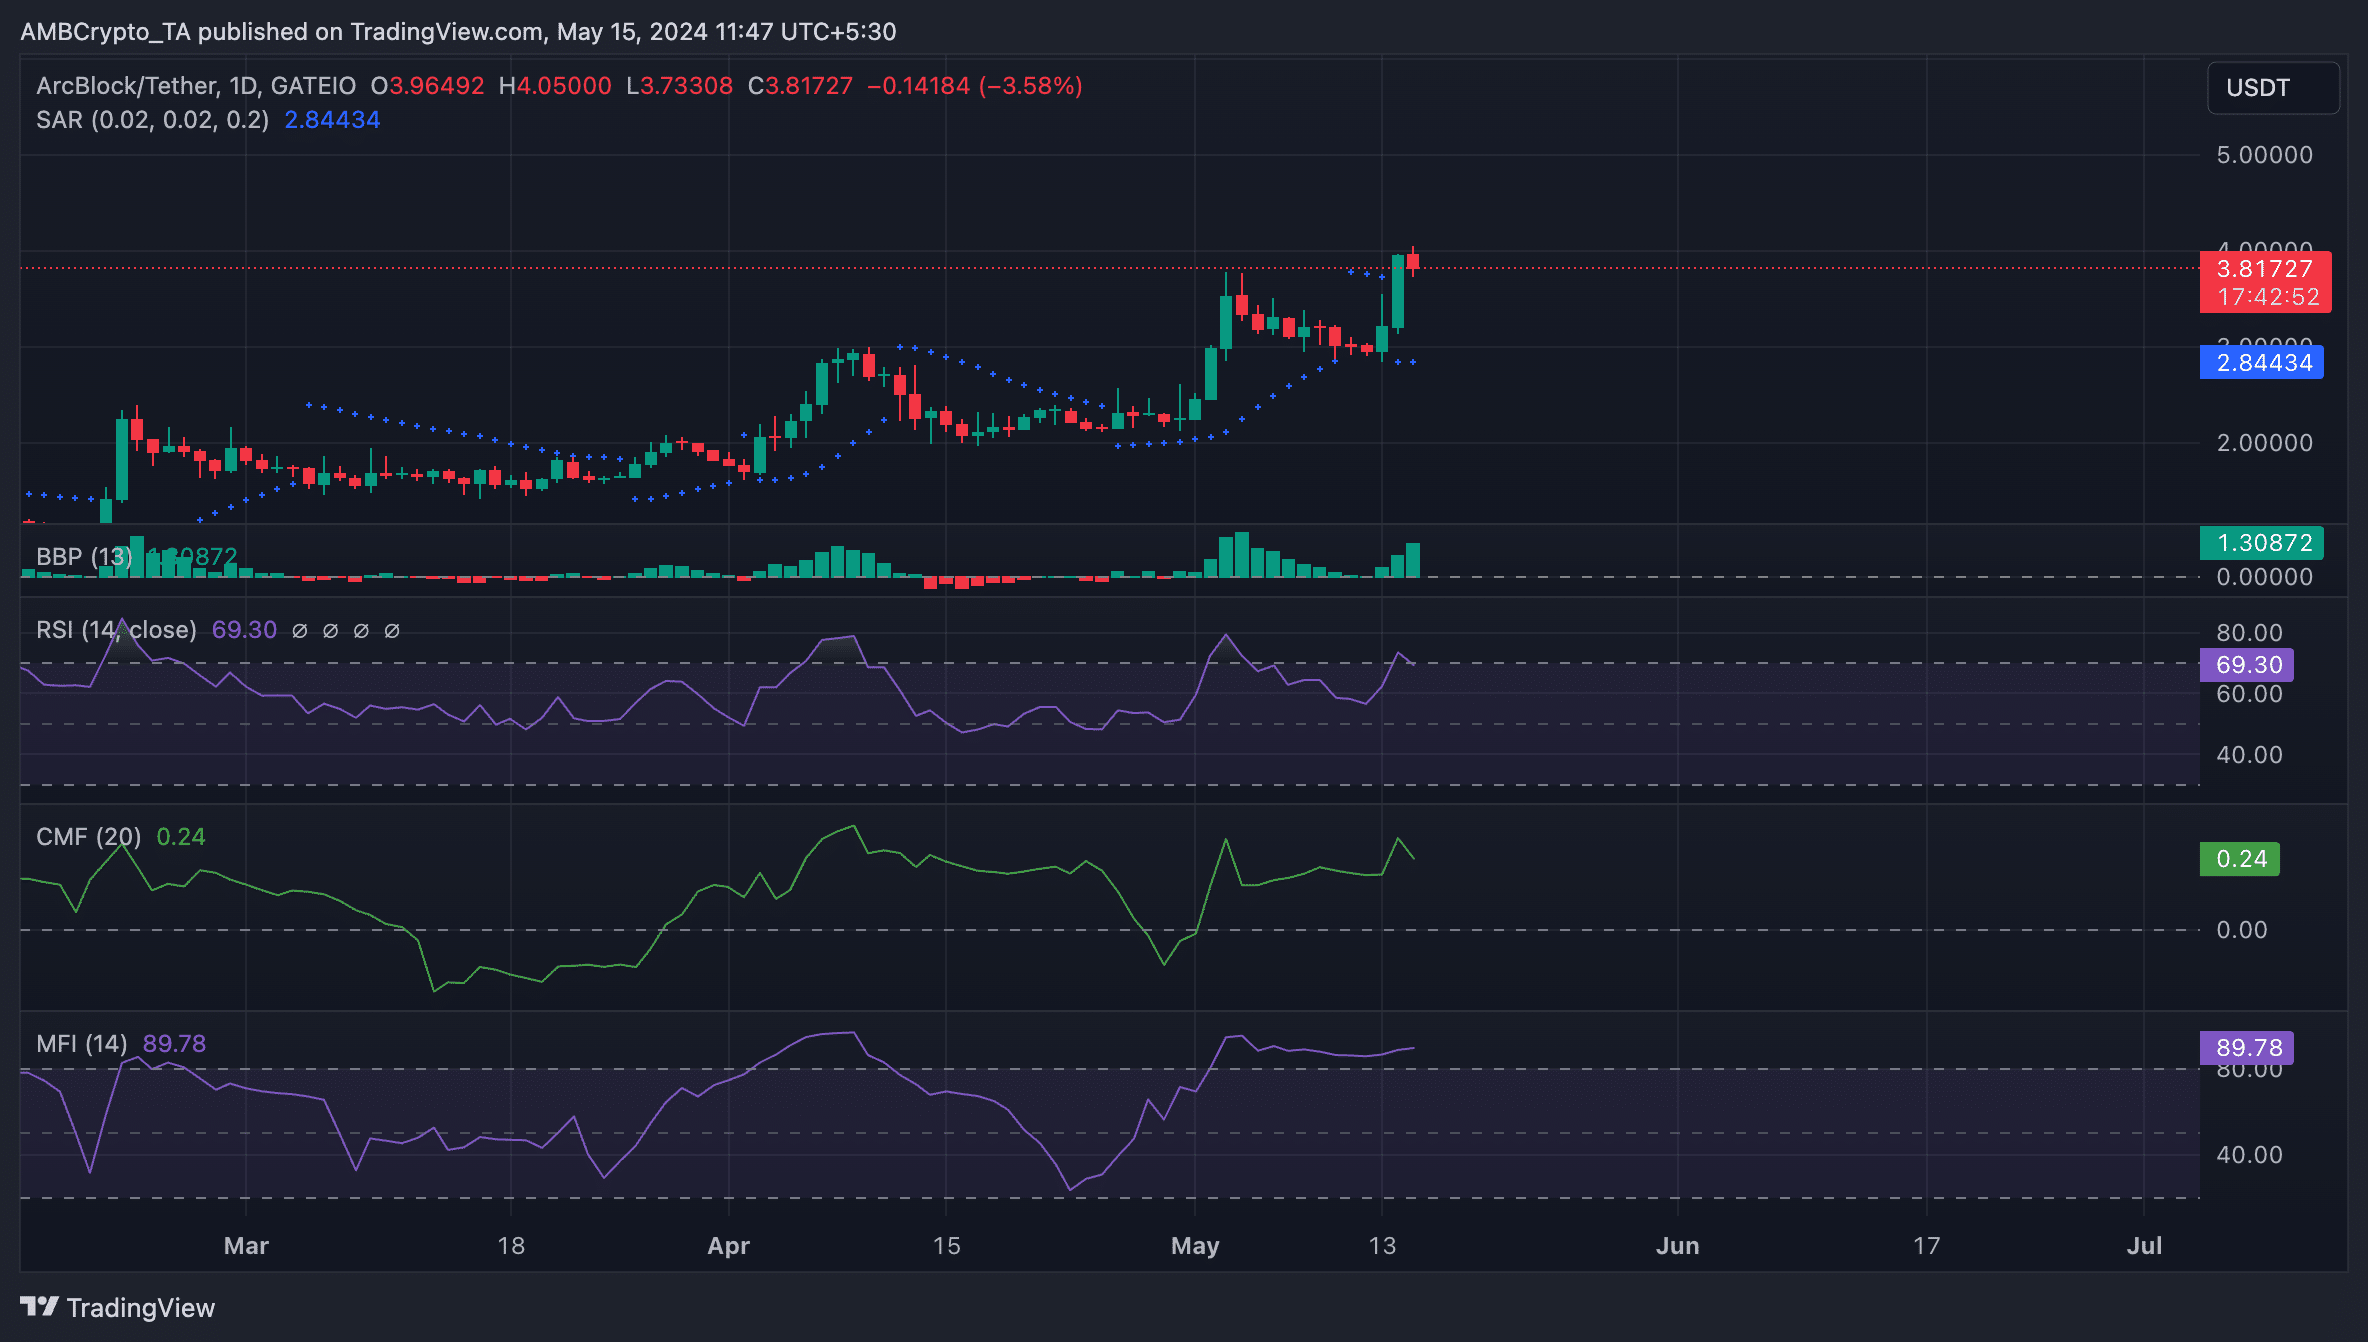
Source: ABT/USDT on TradingView
Read Arcblock’s [ABT] Price Prediction 2024-25
ABT’s next bus stop
Regarding where ABT’s price might be headed next, if bullish momentum is sustained, the token may rally to exchange hands above $4 at $4.12.
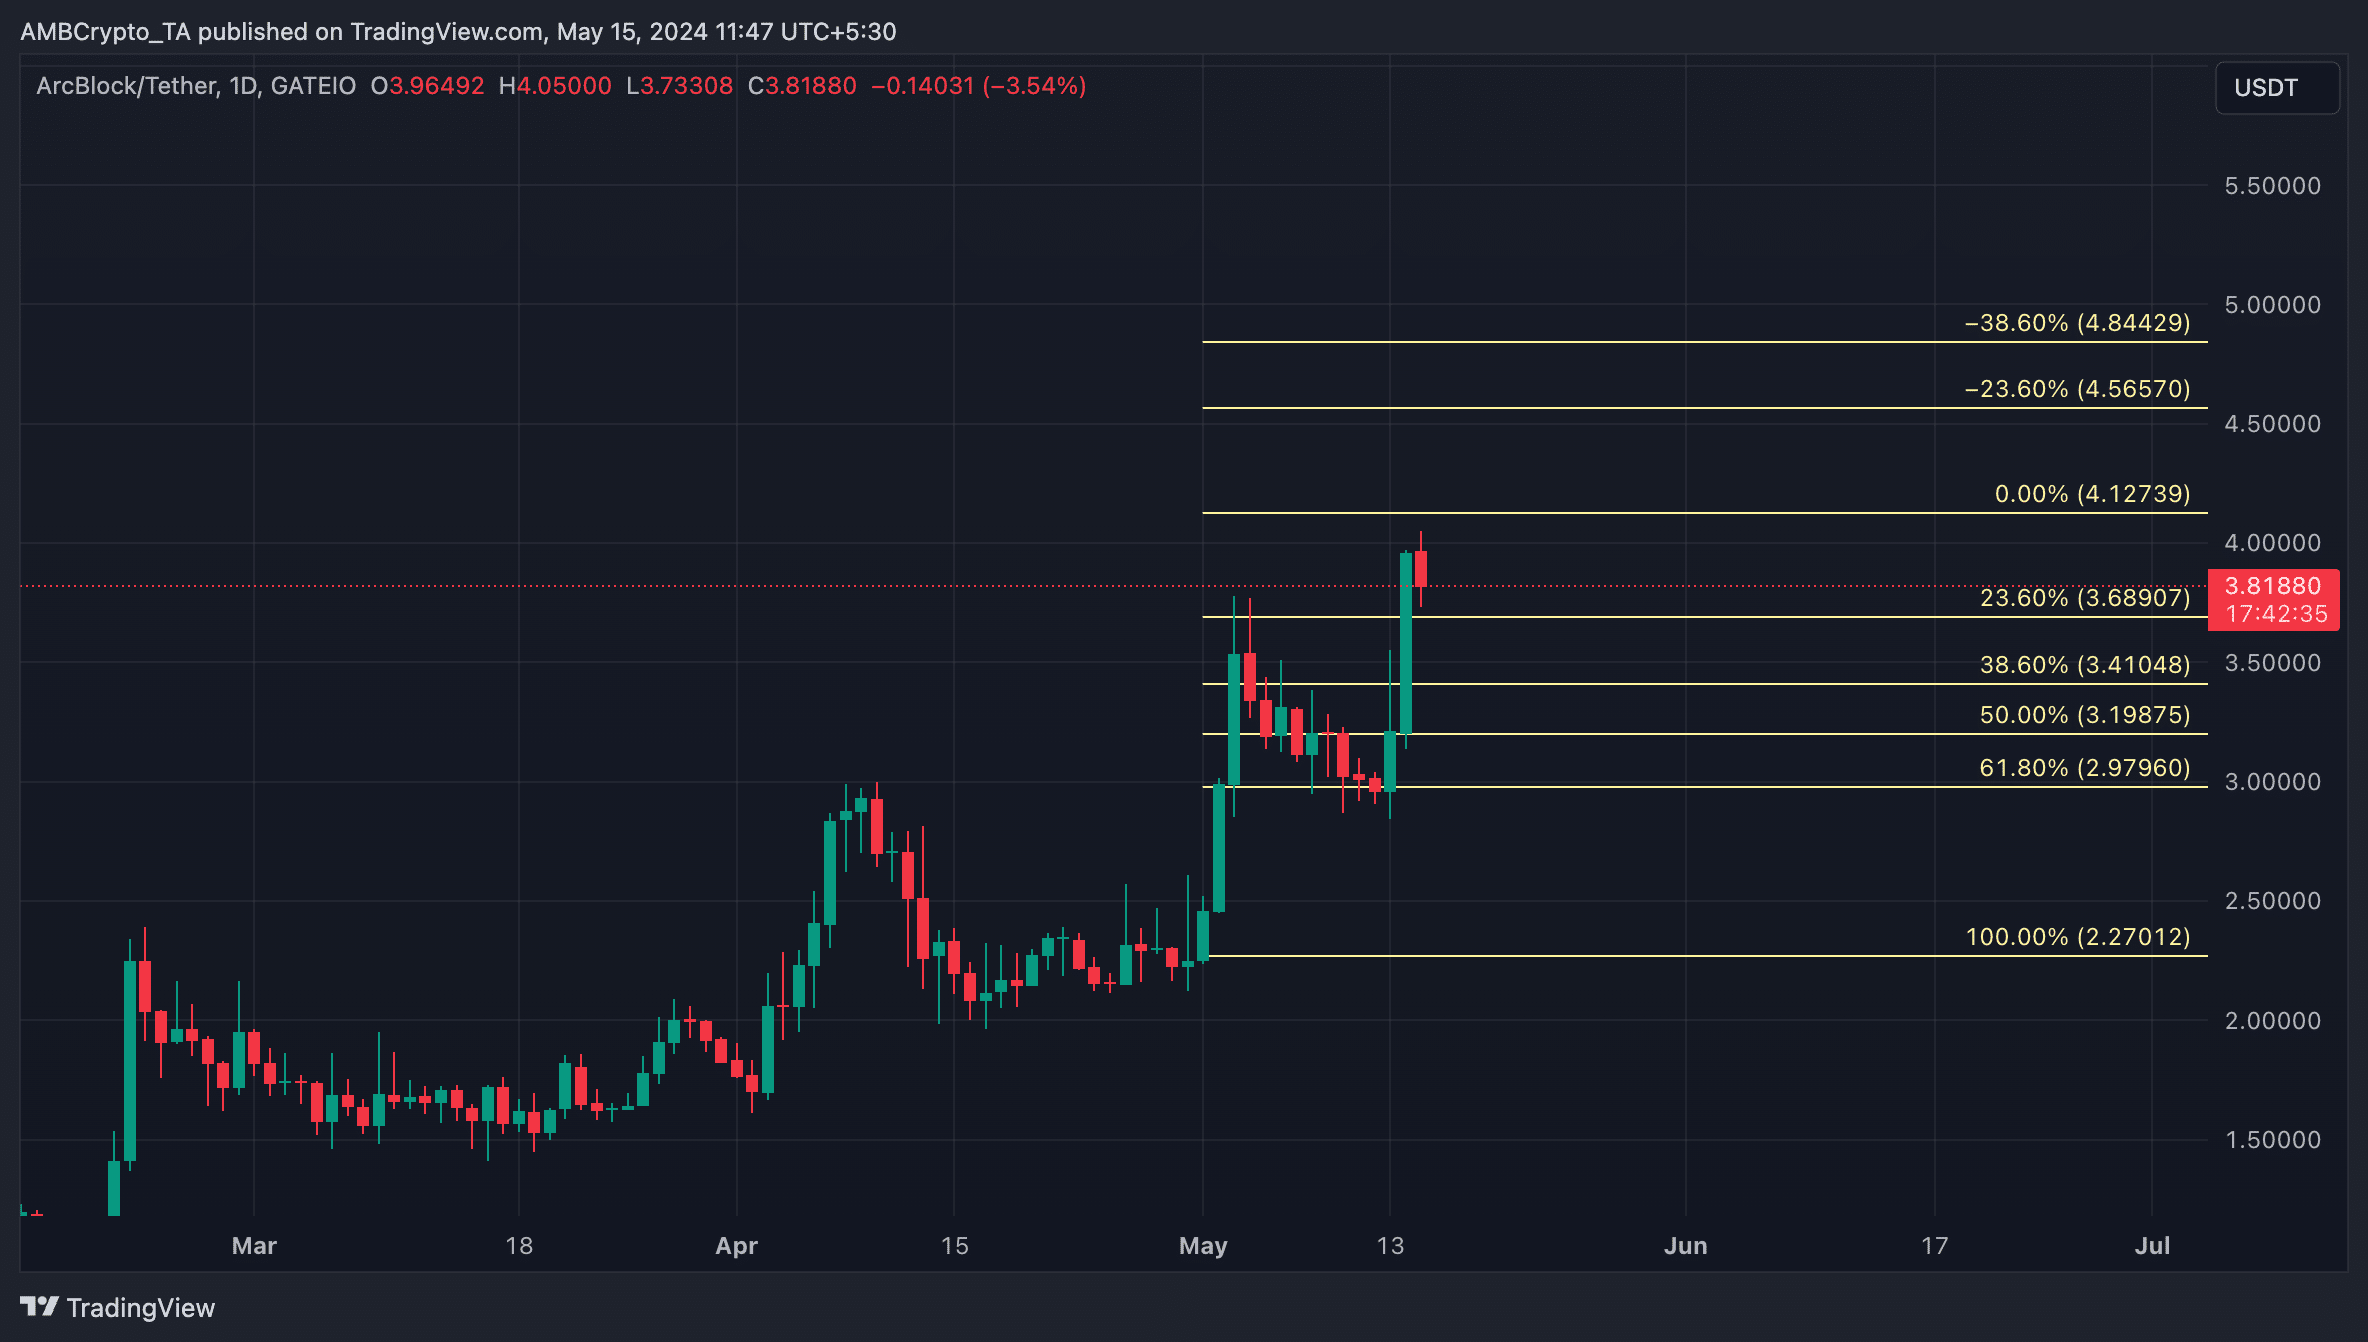
Source: ABT/USDT on TradingView
However, if this projection is invalidated and profit-taking activity spikes, the bears might push the token’s price toward $3.4 or trade at $3.1.